Why this Texas map with counties and cities is different
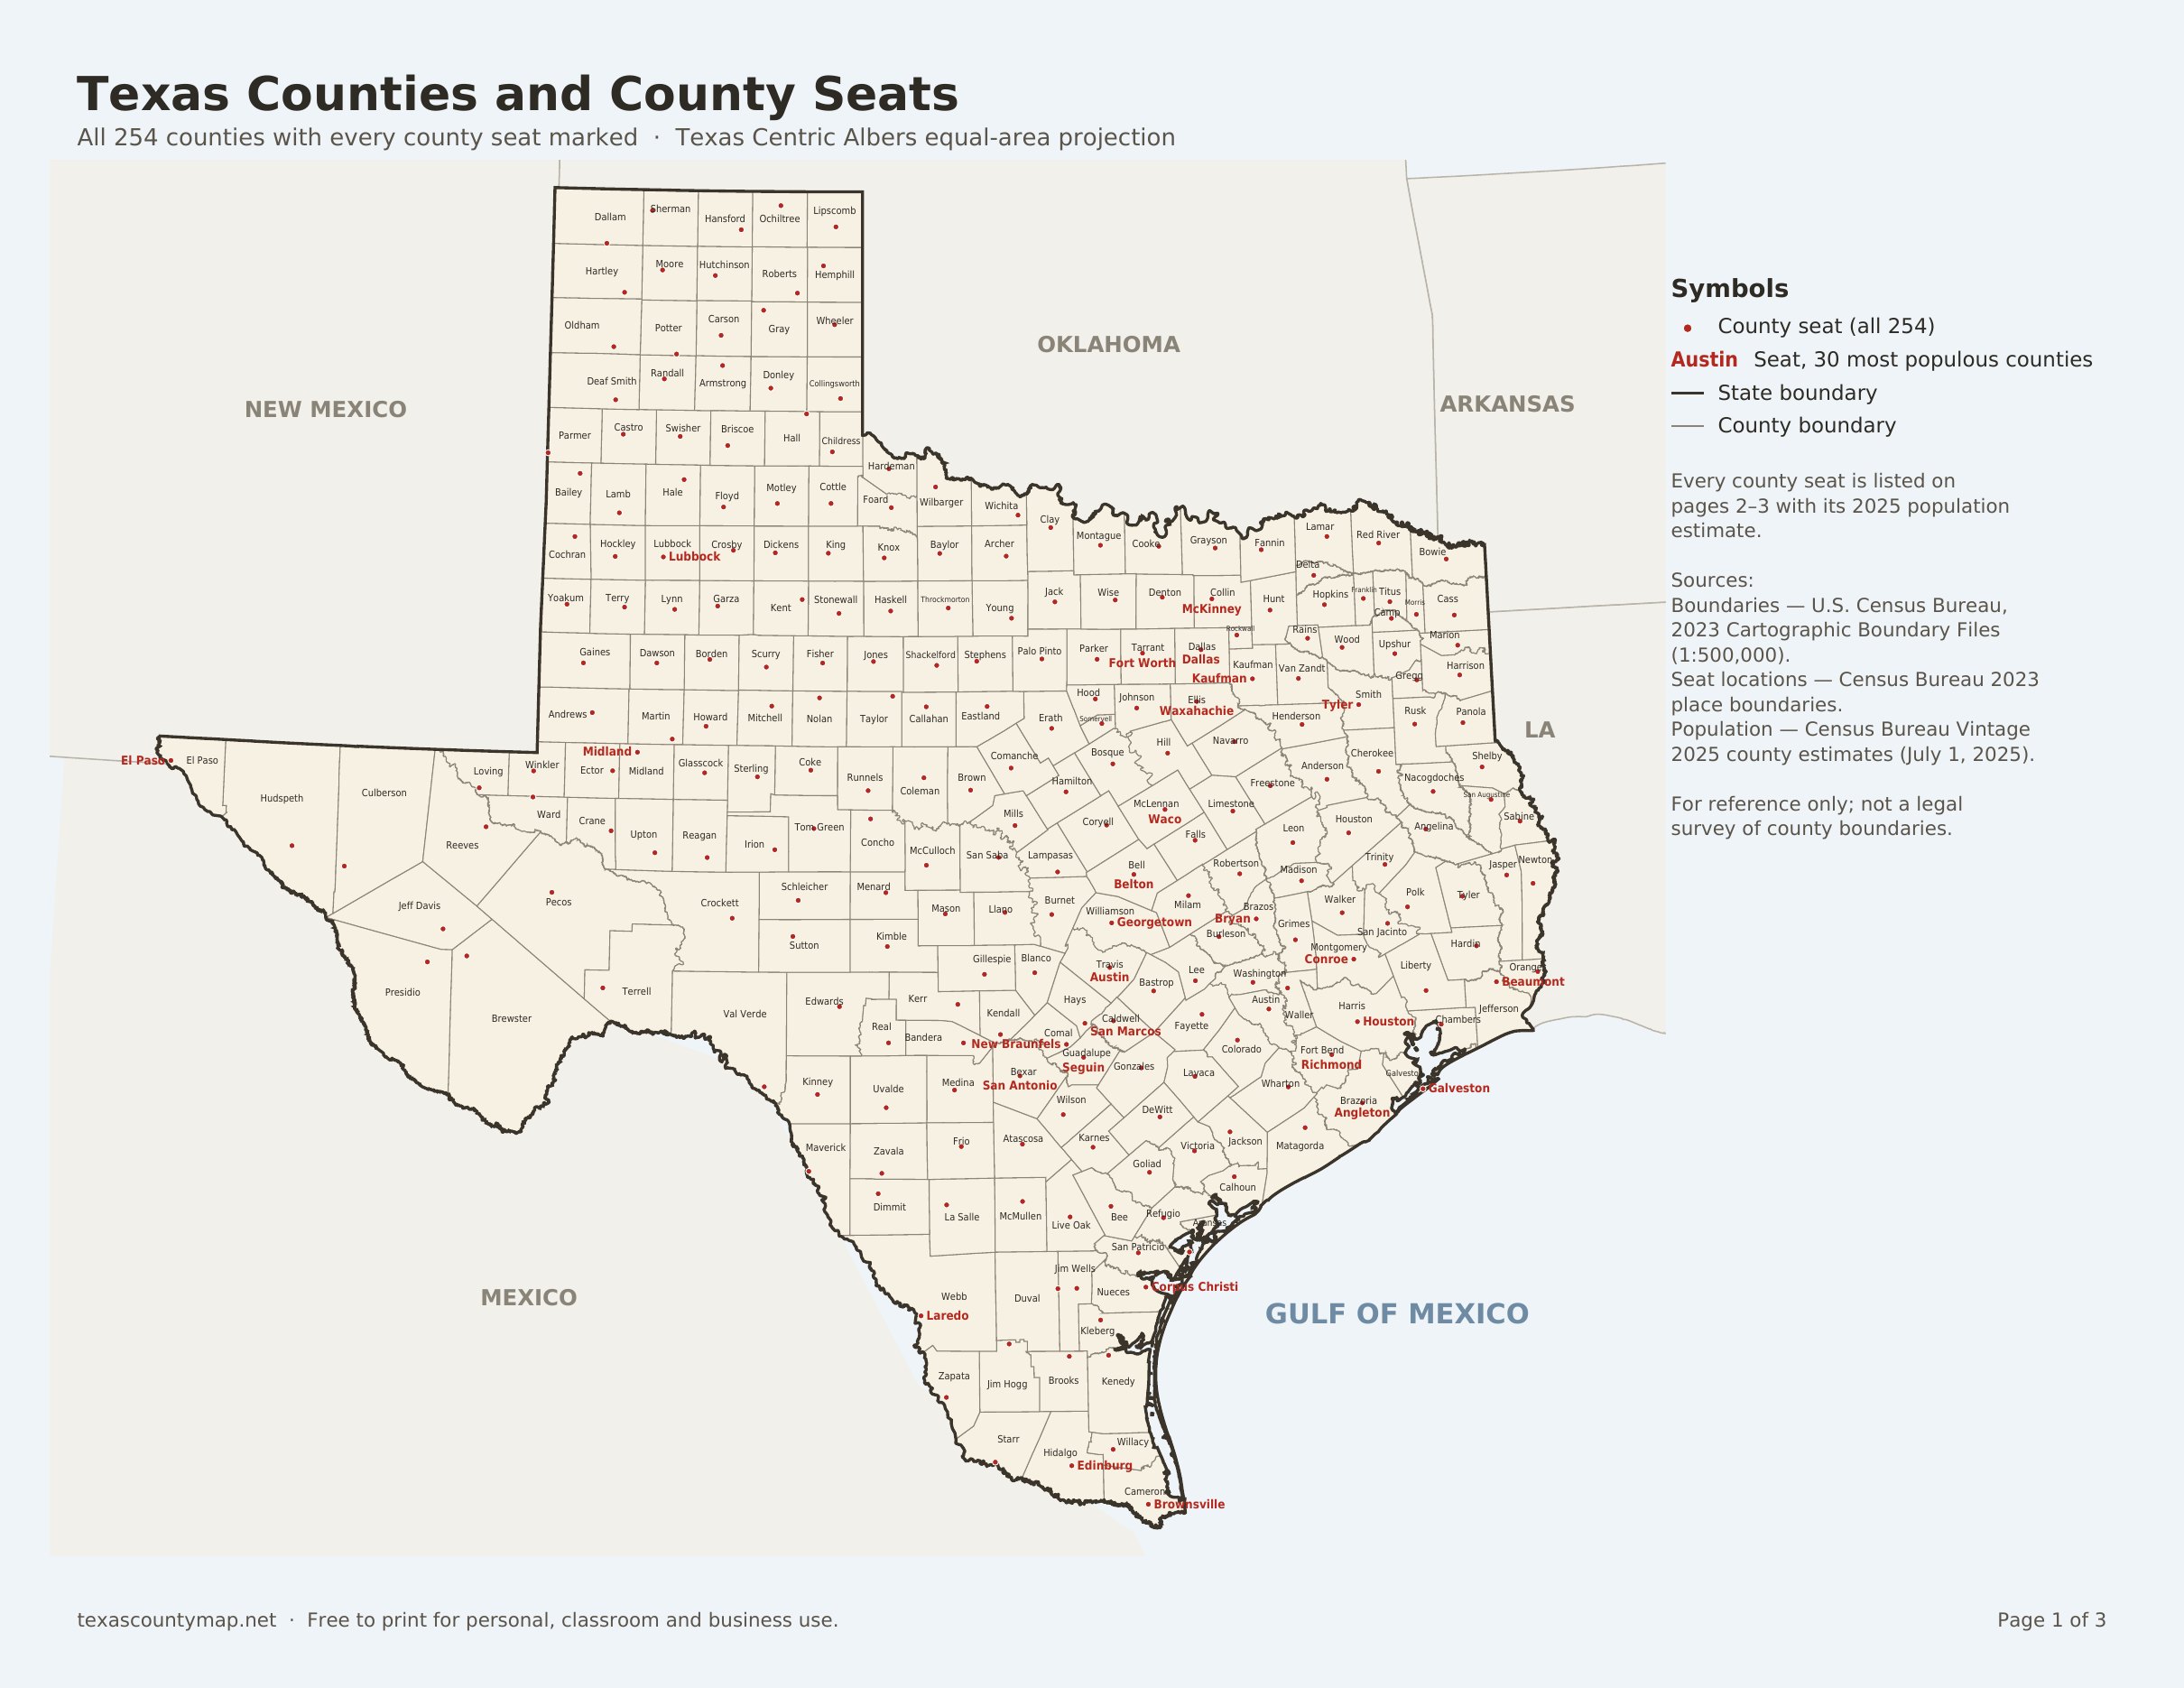
Most "Texas county map PDFs" floating around the internet are 800-pixel JPEGs that have been re-saved a dozen times, with blurry labels, missing counties, or boundaries that don't match the modern Census definition. This file is drawn directly from the U.S. Census Bureau's 2023 Cartographic Boundary Files, which are simplified from the Bureau's TIGER/Line database for mapping. The map uses the Texas Centric Albers equal-area projection, so each county's size on paper is proportional to its real area. Because lines and labels are vector, you can zoom in on a phone or print larger without blurry text.
All 254 county seats, in their real locations
Texas has 254 counties — more than any other state in the United States — and every one of them has a designated county-seat city where the courthouse, county clerk, and most public records live. On the PDF, each seat is placed using the Census Bureau's own boundary for that city or town, so the dot sits where the community actually is. Texas covers more ground than France, so not every name can fit at Letter size:
- Red dot for every seat — all 254, from Houston to Mentone, the seat of Loving County, which is the least populous county in the contiguous United States.
- Red name labels: seats of the most populous counties, named where space allows, including Houston, Dallas, San Antonio, Austin, Fort Worth, El Paso, Lubbock, Corpus Christi, Laredo, McKinney and Brownsville.
- Directory on pages 2–3: every seat named beside its county, so smaller courthouse towns like Pecos and Marfa are easy to look up.
Use cases this PDF was designed for
- K–12 Texas History (7th grade) — print as a labeling worksheet, study sheet, or test-prep reference for the 254-counties unit.
- College urban-planning and political-science courses — overlay on whiteboards for redistricting, gerrymandering, and Texas Triangle discussions.
- Travel planning — figure out which county (and therefore which sheriff's department, courthouse, and ABC laws) applies on a Texas road trip.
- Real estate, insurance, and legal work — quickly look up which seat a property files in.
- Genealogy — county-seat lookups are essential when chasing 19th-century Texas birth, marriage, death, and land records.
A quick orientation: the top 10 counties by population
Most Texans live in the "Texas Triangle", the urban corridor linking Houston, Dallas–Fort Worth, and San Antonio–Austin. These are the 10 most populous counties (Census Bureau 2025 estimates):
| # | County | Seat | Population |
|---|---|---|---|
| 1 | Harris County | Houston | 5,045,026 |
| 2 | Dallas County | Dallas | 2,661,397 |
| 3 | Tarrant County | Fort Worth | 2,248,466 |
| 4 | Bexar County | San Antonio | 2,160,088 |
| 5 | Travis County | Austin | 1,389,670 |
| 6 | Collin County | McKinney | 1,297,179 |
| 7 | Denton County | Denton | 1,069,346 |
| 8 | Fort Bend County | Richmond | 975,191 |
| 9 | Hidalgo County | Edinburg | 921,549 |
| 10 | El Paso County | El Paso | 877,858 |
How to print it perfectly the first time
- Click Download PDF above. The file is about 950 KB.
- Open in Adobe Acrobat, Apple Preview, or your browser's built-in viewer.
- In the print dialog, choose Landscape orientation and set Scale → Fit. Both US Letter (8.5×11) and A4 work. Print page 1 only if you just need the map.
- For a larger classroom copy, print page 1 on 11×17 (Tabloid) paper with "Fit" selected. Lines and labels stay sharp because they are vector.
Licensing and data provenance
Boundaries come from the U.S. Census Bureau Cartographic Boundary Files (2023, 1:500,000), a public-domain federal dataset. Population figures are the Census Bureau's Vintage 2025 county population estimates for July 1, 2025. The map is for reference and is not a legal survey of county lines. You are welcome to print and share it for personal, classroom and business use. A link back to texascountymap.net is appreciated.